
Managing Logs and Events
The Events panel controls which supported activity coreActivity records. The Logs panel shows the entries produced by enabled events. Together, they let you focus on the activity you need, investigate an entry in context, and decide how long to keep the record.
This guide covers the complete workflow. Screenshots illustrate the controls and may show an earlier version of the interface. For installation and the rest of the plugin, start with the Ultimate Guide.
Understand components, events, and entries
A component groups related activity. Each event describes a type of action that component can record; each occurrence that is logged becomes a separate entry. For example, user and plugin activity are handled by different components. Event-specific information varies, and some integrations require another plugin to be active.
The List of Events shows the registered event codes. Components and Events explains how they are organized and lists supported integrations.
Choose which events to log
Before selecting events, check that the main logging switch is active on the Dashboard. Disabling the main switch stops logging across the plugin, even if individual events remain enabled.

- Open Events. On multisite, use the network administration panel for network-wide event controls.
- Use All Sources, All Categories, All Components, or the search box to find the events you want to review. Apply the filter after choosing a value.
- Check each event’s Status, description, and availability where displayed. Use the status switch to enable or disable it.
- For several events, select their checkboxes and choose Enable Events or Disable Events from the bulk actions menu, then apply the action.
Disabling an event prevents future logging for that event; it does not delete entries already in the log. Some events, including REST API reads and several metadata events, are inactive when first registered because they can create many records. Enable them when that detail is useful, then review log volume and retention. See Activity Events for examples and defaults.
Find existing logs for an event
Where entries exist, the Events panel provides Filter and View actions for components and events. Both take you to matching entries in Logs. The focused view presents the chosen component or event as the current view, while filtering keeps the selection in the filter controls. A cleanup action may also be available for entries in a component or event; review its selection before proceeding.
Find activity in the log
Open Logs to see recorded entries. Use the available controls to narrow a large log:
- Choose a period and, where relevant, a component or event.
- Add filters such as request context, country, HTTP method, or object type, then select Filter. The available controls depend on the current view.
- Use the search box when looking for a particular value, and use row actions to follow related entries for a user, IP, event, or object.
- Clear the search, filters, and focused view when you need to broaden the results again.
For example, after receiving a report of an unexpected plugin change, filter for the plugin component and a relevant period. Open an entry to review the event, time, associated user, object, request, and available metadata. Then follow the related user or object log action to examine other entries in context. The data available depends on the event; absence of a field does not prove that no related activity occurred.
Inspect an entry
Use the metadata toggle on a row to expand additional data in the table. Select View for the entry to open the Log Data dialog:
- Data shows the main recorded fields, including the event and request information where available.
- Meta shows event-specific and optional metadata.
- Location shows stored geolocation information when available.
- Device shows detected device or client information when available.
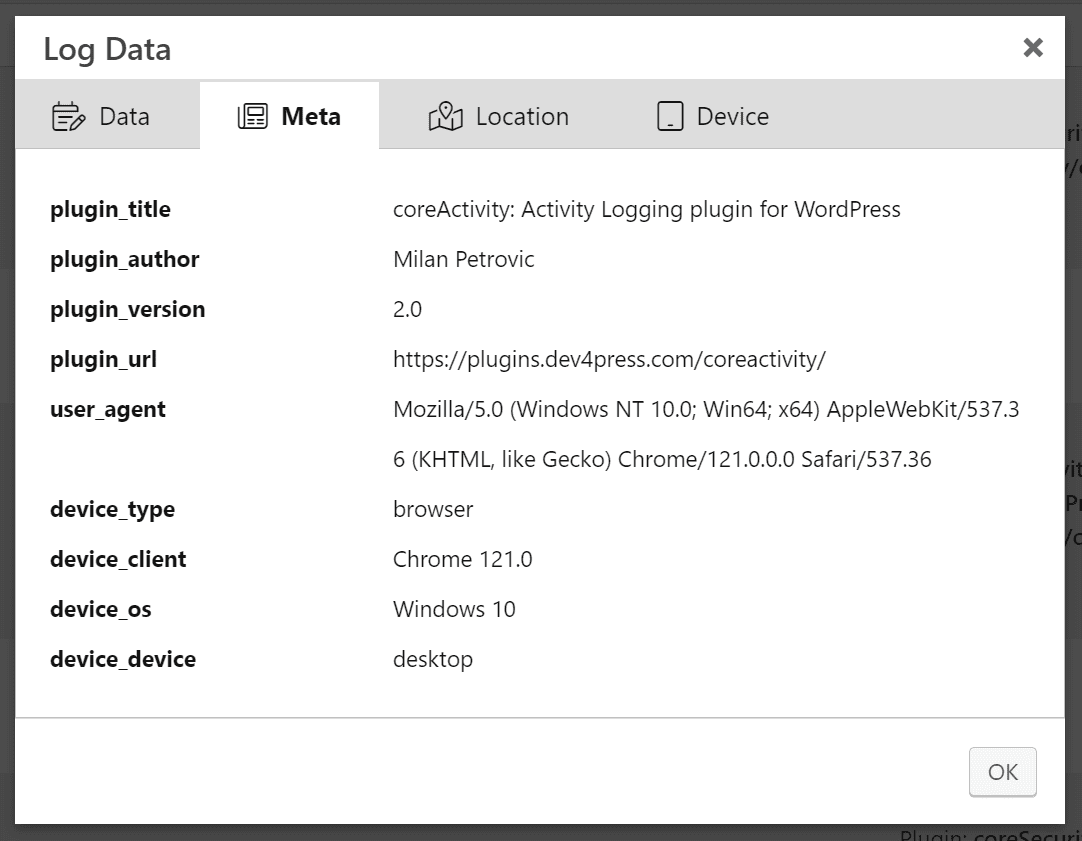
The recorded user, IP, user agent, and location are context for investigation. A user agent can be spoofed, the selected IP depends on your server and proxy configuration, and geolocation is an estimate. Some public IP rows offer a WHOIS lookup; the response comes from an external service and may be incomplete.
Read Activity Logs for the panel details and How Activity Logging Works for an explanation of the stored fields.
Adjust the log display and live updates
In Settings → Logs Panel, select the display options that make the table easier to use. You can show optional columns such as request, protocol, object type, device detection, and metadata, as well as simplified event labels, user avatars, and country flags. Available details depend on the recorded data and your configuration.
The IPv4 display setting masks part of an address in the interface; it does not remove the stored IP. When Live Updates is enabled, the open Logs panel requests new entries every 10 seconds. The current filters and view determine which entries are relevant to the display.

See Activity Settings for the related options and Log Data and Retention for the data to consider when choosing access and retention settings.
Reduce unwanted entries
If the log is difficult to review, start by checking the enabled events. Disable an event you do not need rather than letting it continue to produce entries. Some events support Skip Duplicates, which suppresses matching occurrences within a 24-hour period when enabled.
The Exceptions settings allow selected objects or patterns to be skipped for supported event types. For supported objects, the Logs panel also provides a Do Not Log action. Review an exception before adding it: future activity matching it may no longer appear. See Activity Settings for the exception lists.
Send notifications for selected events
An event’s notification switches and the global notification settings work together:
- Open Settings → Notifications and enable instant notifications, the daily digest, or the weekly digest as needed. Configure recipients and the delay or schedule for each type.
- In Events, enable the corresponding notification switch for each event you want included. Use the event bulk actions or Tools → Notifications to change several switches together.
- Generate an eligible event, check that it appears in Logs, and confirm delivery. Instant messages may be delayed to group activity; scheduled emails depend on WordPress cron and the site’s mail delivery.

See Activities Notifications and the Notifications tool for more detail.
Delete entries and configure retention
Choose a retention period based on the information your site records and how long it is useful. Settings → Maintenance controls automatic cleanup of entries older than the configured number of months. New installations default to automatic cleanup with a 24-month period; check your site’s actual settings. The daily cleanup job depends on WordPress cron.
For selected rows, use the Delete bulk action in Logs. For an age and one or more event types, use Tools → Data Cleanup and review both the period and selected events before applying it.

Deleting entries removes data and cannot be undone by the plugin. Export Settings does not export the event or log tables; include the relevant database data in your backup arrangements. See Log Data and Retention and Activity Tools.
Multisite and troubleshooting
On multisite, the network log provides a centralized view, while a site’s Logs panel is limited to that site. Network-level activity can use blog ID 0. Settings and event management are centralized in Network Admin. See Multisite Support.
If an expected entry is missing, check the main logging switch, event status and integration availability, filters, exceptions, duplicate settings, and retention. Requests served entirely from a cache without loading WordPress cannot be recorded by coreActivity. For step-by-step checks, see Troubleshooting coreActivity, Cache Plugins, and REST API Logging.